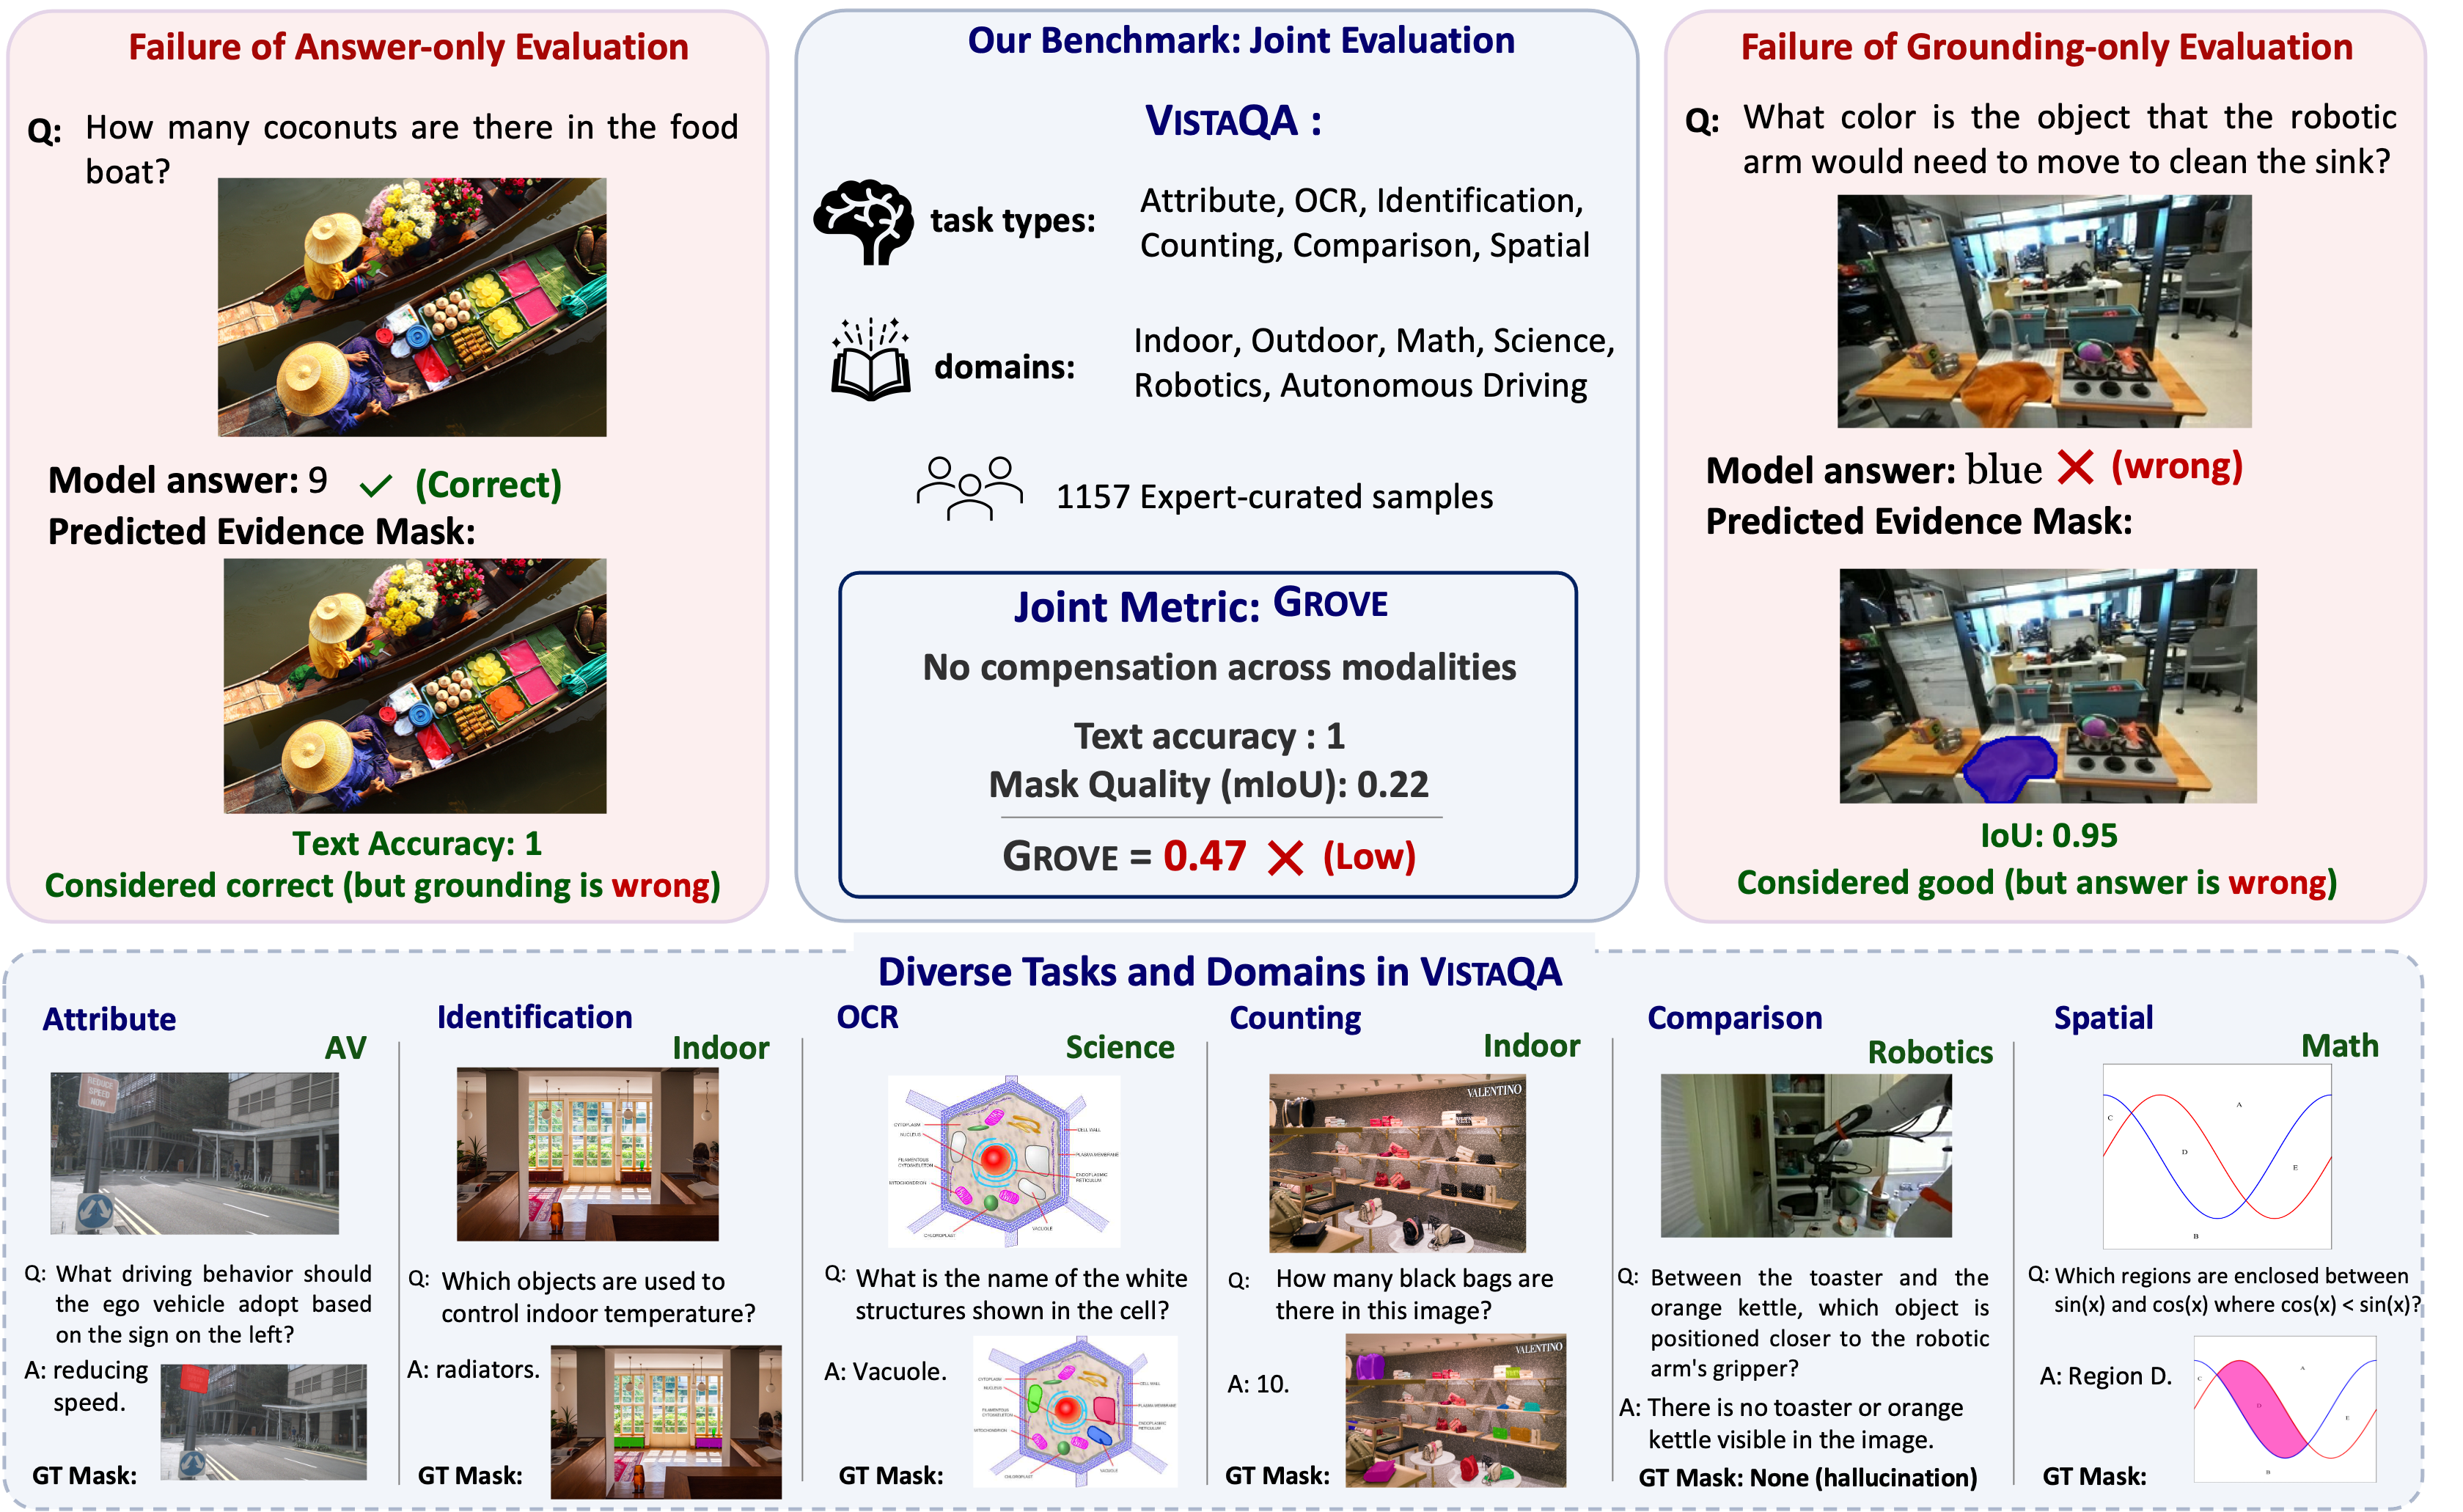
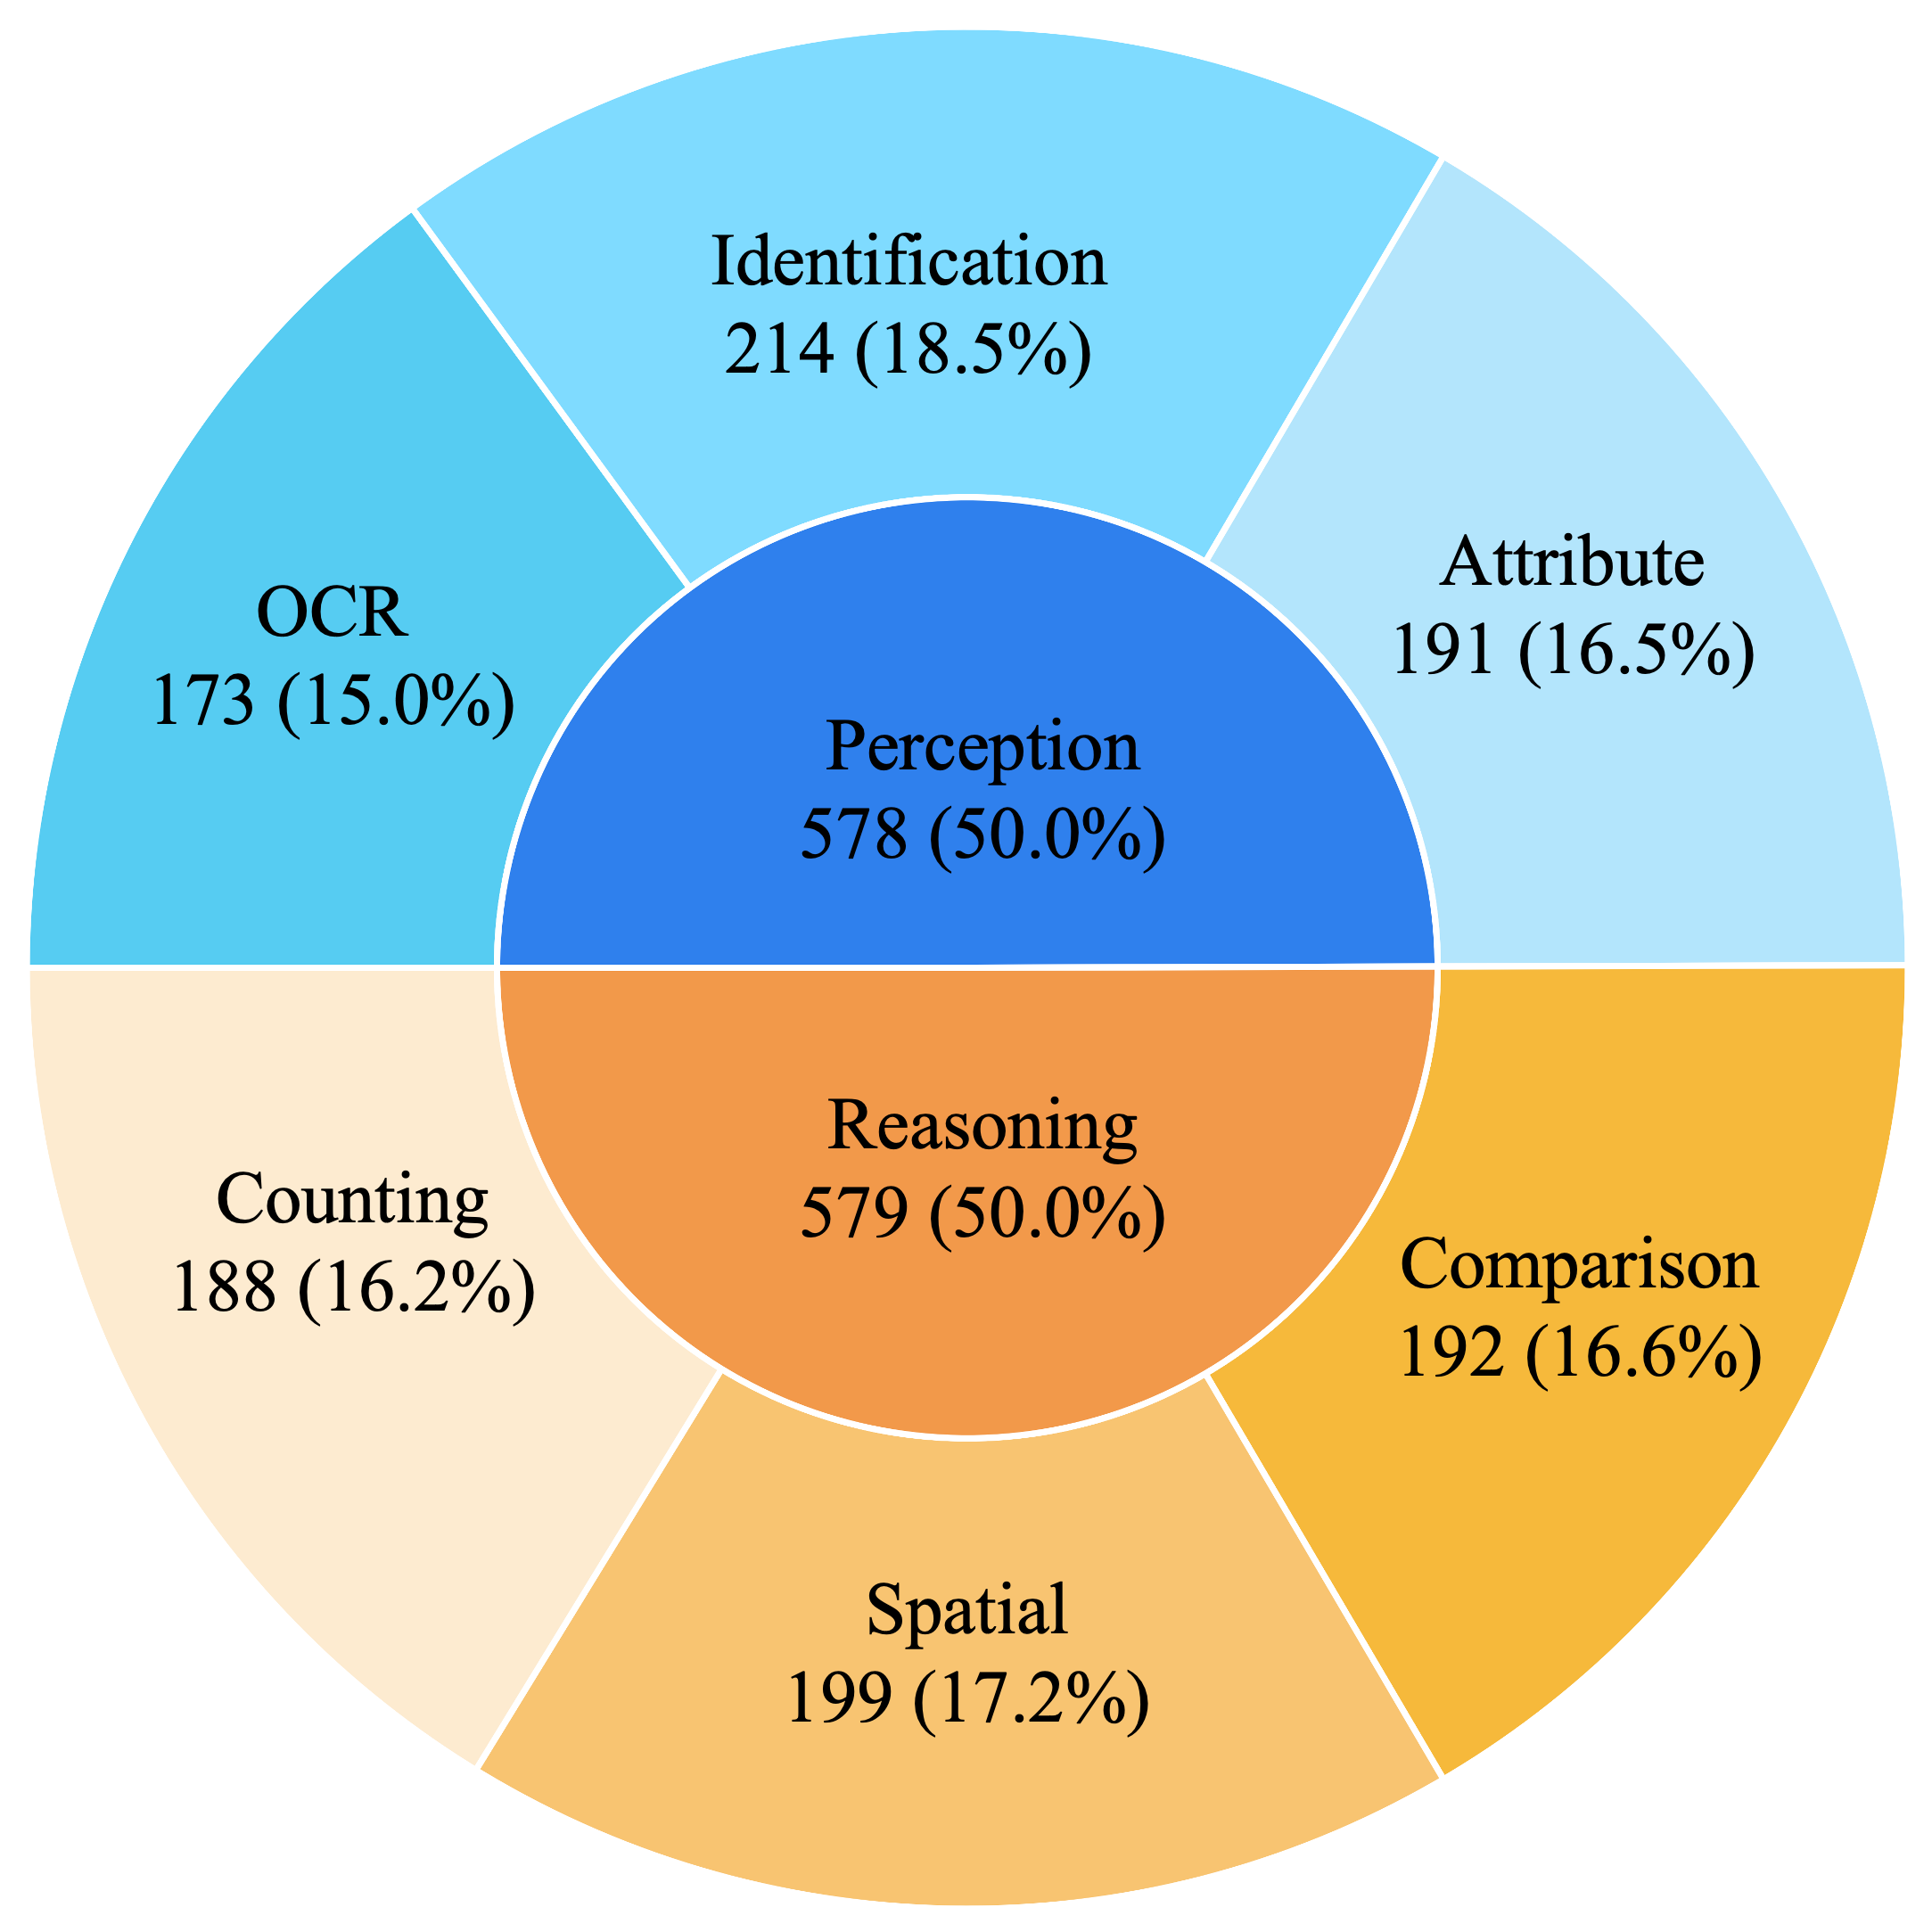
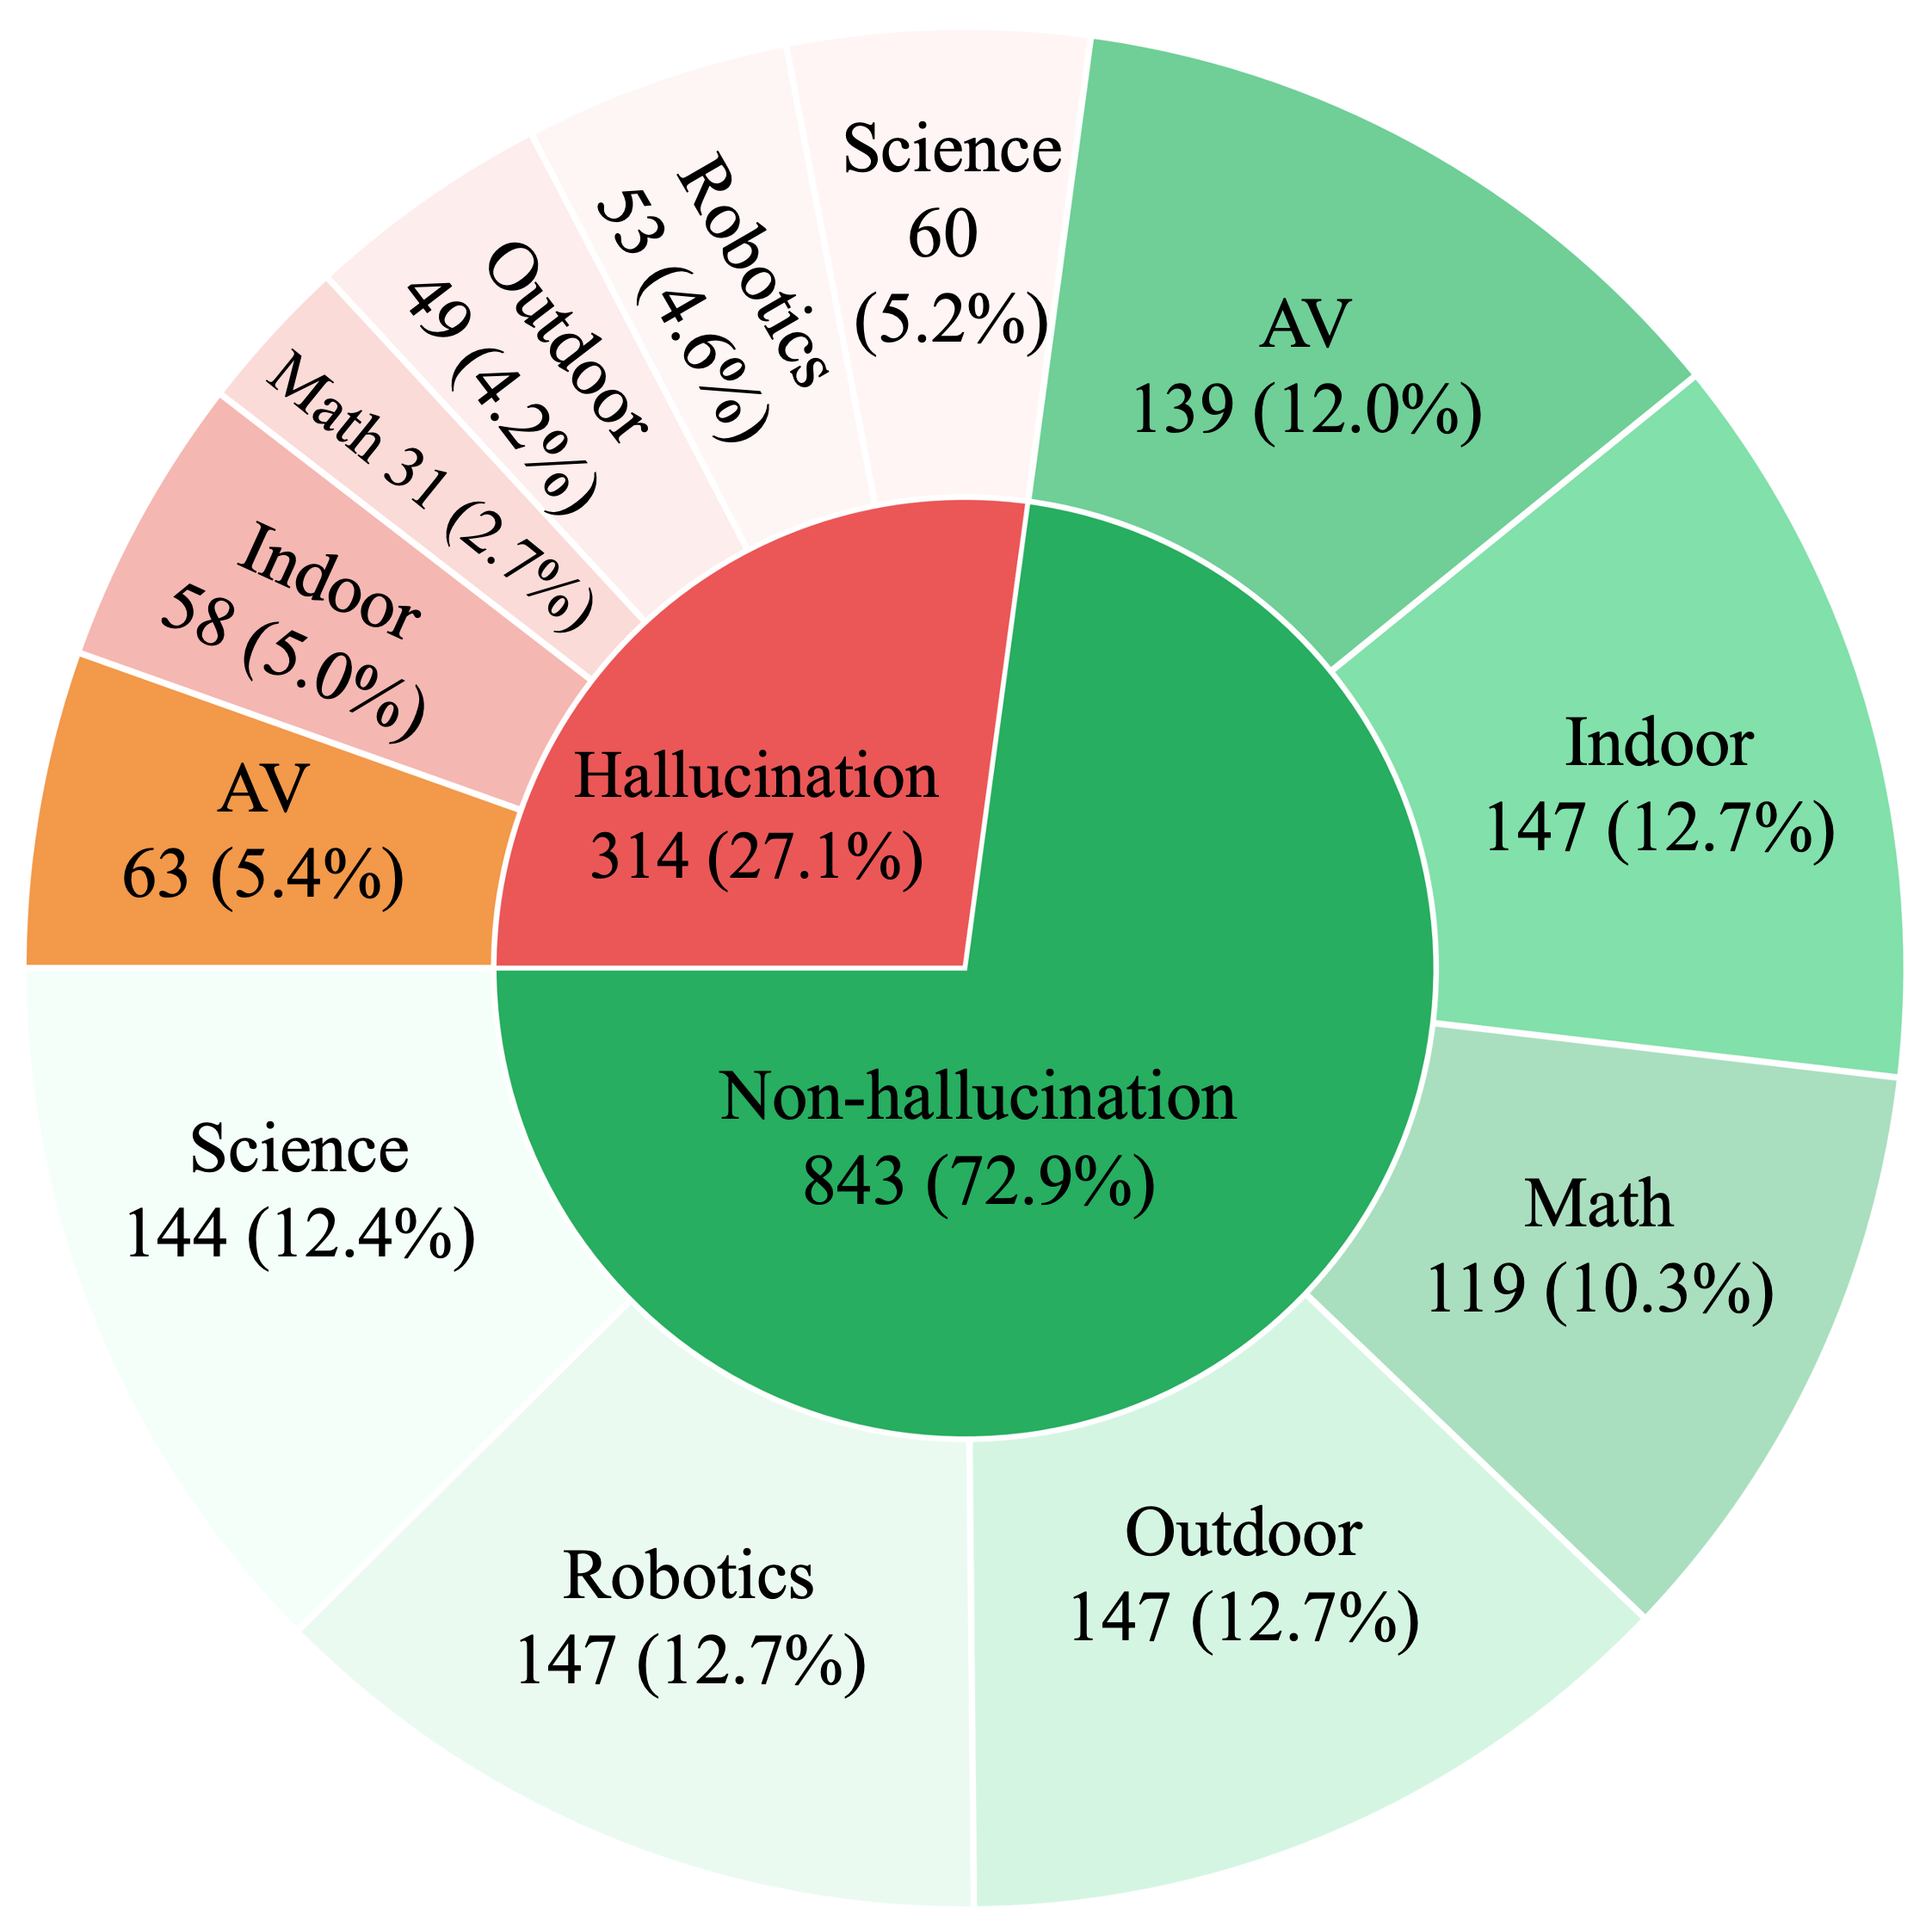
Establishing a clear link between model predictions and the visual evidence that supports them is critical for transparency and reliability in multimodal reasoning, yet current multimodal large language model (MLLM) evaluations do not explicitly enforce this alignment. Existing benchmarks assess either textual answer correctness or pixel-level localization in isolation, leaving the coupling of reasoning and grounding an open challenge. We introduce VistaQA, a comprehensive benchmark for joint evaluation of free-form answer correctness and pixel-level evidence grounding in visual question answering. VistaQA comprises 1,157 expert-curated samples spanning six task types and six visual domains, ranging from direct perception to compositional and relational reasoning. VistaQA requires models to not only answer correctly, but to also provide precise segmentation masks that support their answers. It also includes hallucination-aware examples where no valid visual evidence exists. To support this enhanced evaluation, we introduce GROVE, a unified evaluation metric that enforces joint correctness by combining textual accuracy and grounding quality via a per-sample geometric mean, ensuring neither dimension can compensate for deficiencies in the other. Comprehensive experiments across grounding-aware models and hybrid pipelines with general-purpose MLLMs reveal that even the strongest systems achieve limited performance under GROVE, highlighting a substantial gap between answer accuracy and visual evidence alignment.
GROVE computes a joint score for each sample as the geometric mean of an epsilon-floored binary answer correctness score and an epsilon-floored mask quality score (mIoU). By coupling reasoning and evidence at the sample level, GROVE ensures that strong performance requires models to simultaneously provide both correct answers and precise supporting visual evidence.
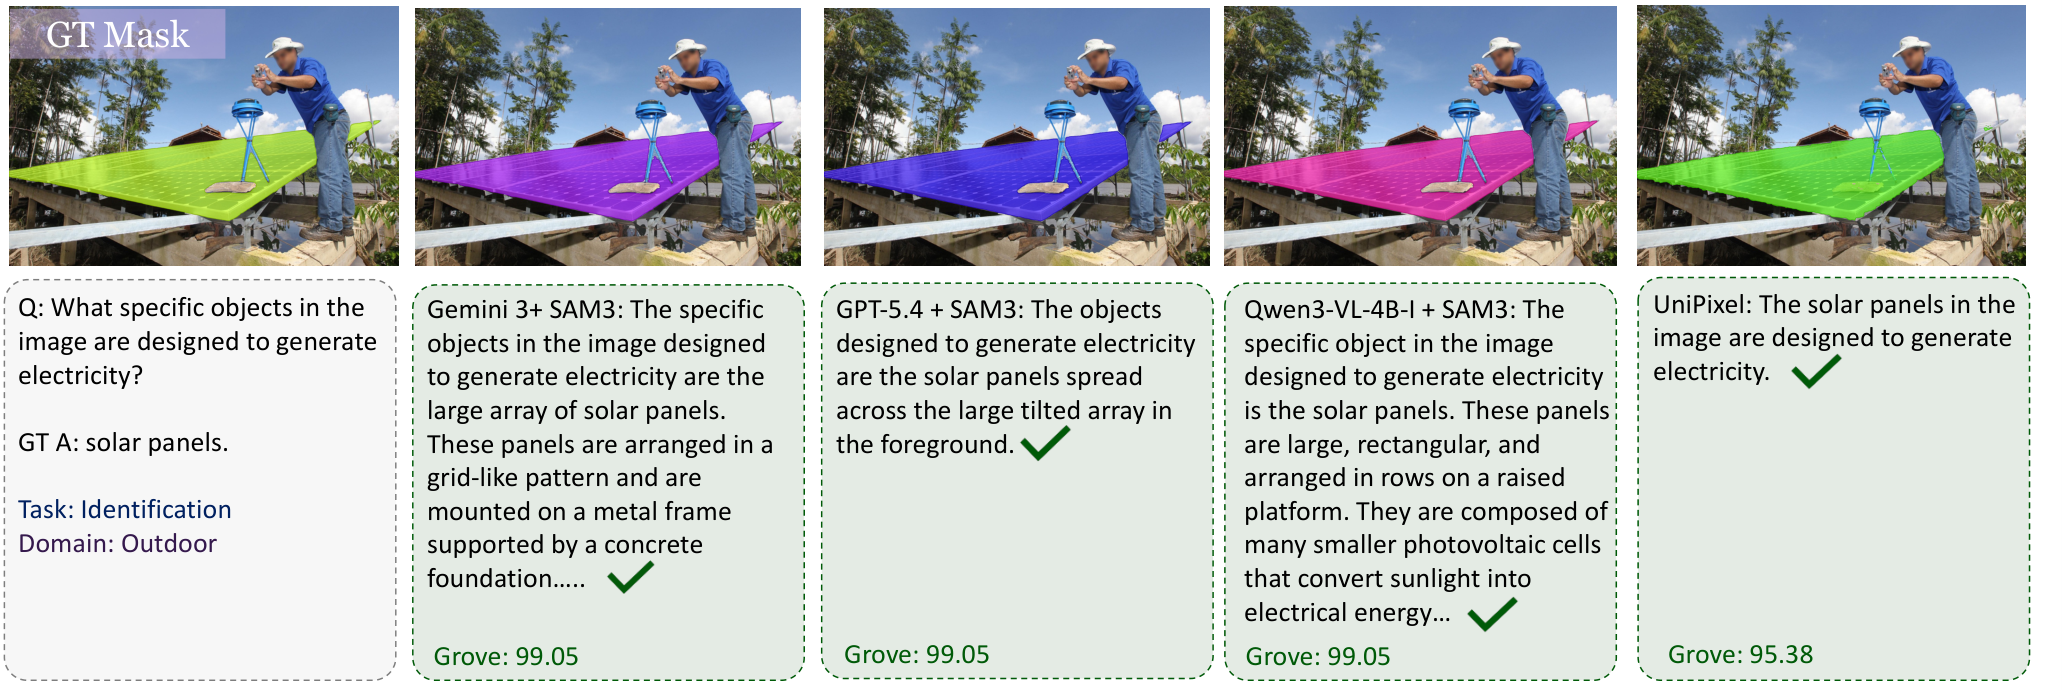
Across reasoning segmentation models, grounding-aware models and hybrid MLLM + SAM3 pipelines, all evaluated systems achieve limited GROVE scores, highlighting the difficulty of simultaneously satisfying textual correctness and pixel-level evidence grounding.
| Model | Overall | Identification | Attribute | OCR | Spatial | Counting | Comparison |
|---|---|---|---|---|---|---|---|
| GPT-5.4-T + SAM3 | 45.53 | 53.62 | 44.73 | 44.16 | 38.86 | 52.21 | 38.93 |
| Qwen3-VL-4B-I + SAM3 | 43.30 | 50.36 | 47.46 | 40.96 | 36.32 | 45.52 | 38.43 |
| Qwen3-VL-32B-I + SAM3 | 42.72 | 48.41 | 46.37 | 42.14 | 35.91 | 45.72 | 37.41 |
| GPT-5.4 + SAM3 | 41.50 | 48.22 | 40.43 | 41.33 | 35.62 | 47.06 | 35.86 |
| Gemini 3 + SAM3 | 39.63 | 43.10 | 40.11 | 42.55 | 33.53 | 42.81 | 35.84 |
| VRT-RL | 29.02 | 34.92 | 28.74 | 27.43 | 24.44 | 29.94 | 28.01 |
| Sa2VA-8B | 25.74 | 26.79 | 30.44 | 25.36 | 22.87 | 20.46 | 28.36 |
| UniPixel-7B | 22.39 | 22.24 | 28.29 | 22.19 | 19.90 | 15.36 | 26.34 |
| TreeVGR-7B | 19.03 | 18.28 | 18.55 | 16.42 | 17.90 | 20.25 | 22.65 |
| SESAME-7B | 17.02 | 17.90 | 17.14 | 13.62 | 18.48 | 17.60 | 16.90 |
| LISA-7B | 15.47 | 15.16 | 16.92 | 12.44 | 15.29 | 16.56 | 16.23 |
| GLaMM-7B | 13.53 | 14.86 | 12.89 | 12.34 | 14.19 | 11.84 | 14.70 |
| LaSagnA-7B | 12.35 | 13.31 | 12.03 | 11.04 | 13.23 | 11.14 | 13.05 |
| Uground-7B | 11.78 | 10.95 | 11.69 | 11.15 | 11.57 | 12.15 | 13.22 |
| Model | Non-Hallucination | Hallucination | Indoor | Outdoor | Math | AV | Robotics | Science |
|---|---|---|---|---|---|---|---|---|
| GPT-5.4-T + SAM3 | 44.65 | 47.89 | 45.39 | 45.92 | 41.51 | 53.18 | 47.01 | 39.24 |
| GPT-5.4 + SAM3 | 43.28 | 36.72 | 42.06 | 46.05 | 28.99 | 53.43 | 39.87 | 35.54 |
| Qwen3-VL-32B-I + SAM3 | 37.63 | 56.41 | 44.27 | 47.63 | 23.23 | 58.40 | 40.09 | 37.85 |
| Qwen3-VL-4B-I + SAM3 | 36.81 | 60.72 | 43.64 | 46.84 | 27.37 | 59.39 | 41.78 | 36.80 |
| Gemini 3 + SAM3 | 33.48 | 56.14 | 39.37 | 39.40 | 31.40 | 48.42 | 37.15 | 39.87 |
| VRT-RL | 32.09 | 20.79 | 29.61 | 33.06 | 24.68 | 30.76 | 27.74 | 27.27 |
| Sa2VA-8B | 31.01 | 11.58 | 22.64 | 24.03 | 14.87 | 36.87 | 25.10 | 28.09 |
| UniPixel-7B | 25.98 | 12.75 | 21.76 | 23.20 | 12.90 | 28.87 | 21.02 | 24.15 |
| TreeVGR-7B | 17.68 | 22.66 | 18.41 | 20.45 | 12.70 | 23.51 | 19.76 | 17.78 |
| GLaMM-7B | 14.48 | 10.96 | 12.82 | 13.75 | 11.13 | 15.70 | 13.43 | 13.72 |
| LISA-7B | 14.01 | 19.39 | 16.01 | 16.41 | 12.15 | 16.50 | 15.97 | 14.95 |
| LaSagnA-7B | 13.12 | 10.28 | 11.31 | 12.18 | 11.07 | 14.05 | 12.09 | 13.07 |
| SESAME-7B | 12.17 | 30.04 | 17.20 | 17.68 | 11.05 | 20.77 | 15.92 | 17.97 |
| Uground-7B | 10.94 | 14.03 | 11.32 | 10.74 | 10.78 | 11.79 | 13.40 | 12.38 |
Explore representative VISTAQA examples by outcome type. Each tab shows four examples from the corresponding qualitative figure.
@article{nasrazadani2026vistaqa,
  title={VISTAQA: Benchmarking Joint Visual Question Answering and Pixel-Level Evidence},
  author={Nasr Azadani, Mozhgan and Wang, Yimu and Zhu, Yongpeng and Chen, Lihong and Ganai, Milan and Sedwards, Sean and Pavone, Marco and Czarnecki, Krzysztof},
  year={2026},
  note={arXiv:2605.20676}
}